Posts · Physics
The Neutrino Bound That Moved
Swap one South Pole Telescope data release for the next, and a limit on the neutrino masses tightens. Before reading anything into that, a paper asks whether the two releases agree with each other. They do not.
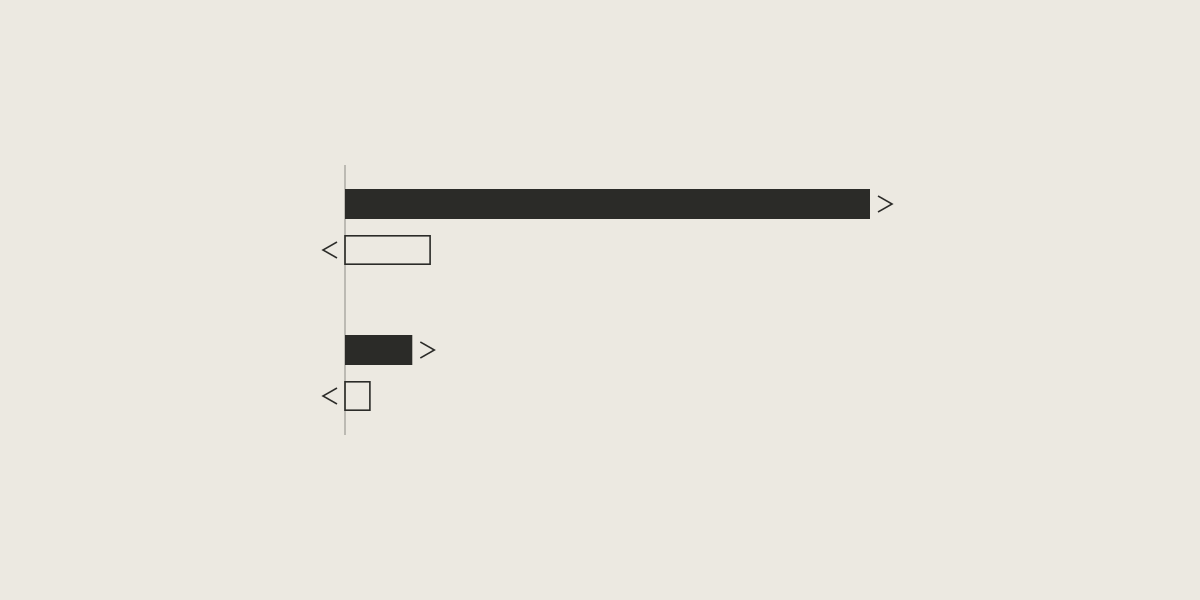
Two releases of data from the same telescope, looking at essentially the same patch of sky, were swapped in an analysis of the neutrino masses, and the upper limit on their sum tightened, from below 0.11 to below 0.069 electronvolts (eV), the unit in which particle masses are usually quoted. The analysis is by Gorbunov and Nedelko (2026, as cited in the paper discussed here), and it used the South Pole Telescope (SPT): first its 2018 release, then a later release called D1, built from the 2019 and 2020 seasons. The authors called the shift "curious", the paper reports, "because both releases observe essentially the same field".
The summed mass of the three neutrinos is, in the words of Six Birds for Neutrino Mass, "one of the main targets of precision cosmology". It is not weighed on a scale. It is constrained by combining the cosmic microwave background, the oldest light in the sky, with later measurements of distances across the universe, and the result is usually an upper limit. So a limit that moves when one data release replaces another deserves a close look.
In the outside analysis, the swap also brought in the telescope's matching lensing data, a separate product of the same telescope. The paper discussed here leaves the lensing data out and swaps only the main temperature and polarization measurements.
A simpler question first
Before asking what the shift means, the paper asks something simpler. If two releases look at the same sky, the best explanation of one should fit the other reasonably well. Does it?
The test is directional. Fit release A and find the parameters that describe the universe best for it, the neutrino mass among them. Then carry those parameters over to release B, let B re-tune a few of its own instrument and foreground settings where the setup allows, and ask how much worse B fits there than at its own best. The answer is a difference in χ², the standard score of misfit between a model and data, where larger means worse. The paper treats this as "a comparative diagnostic" and does not turn it into odds that the difference is due to chance: "It is not a calibrated p-value". And the direction matters. B tested at A's fit need not cost the same as A tested at B's.
The vocabulary comes from Six Birds Theory, the framework behind this site, which is about what survives when detail is compressed into a simpler description. The paper calls each data release a lens, a way of compressing raw observations into a fit to the data, and adds at once that "'lens' never means gravitational lensing". The physical model and its assumptions complete the picture, and what gets reported is the package of the two together. The paper is modest about what the framework adds: "The SBT language provides the vocabulary of the audits. It is not a theorem that supplies the missing physical steps."
The two releases disagree
Paired with distance measurements from the DESI survey, D1 tested at the 2018 fit costs about 488 units of χ². The reverse, 2018 tested at the D1 fit, costs about 79. With part of the data from the Planck satellite added to both, the numbers fall to about 63 and 23, which the paper says is consistent with the extra shared data holding the two fits closer together. The imbalance remains. In every setting the paper ran, D1 tested at the 2018 fit is the more expensive direction. The paper does not explain why.
The paper tests three possible explanations for the mismatch, each a known difference between the releases or the calculation. D1 covers some scales on the sky that the 2018 release does not; cutting it back to the 2018 coverage changes little. Each release also comes with its own built-in assumption about one of the cosmological parameters; dropping the telescope's version changes little. Neither does raising the numerical precision of the physics code. Each of these changes moves each number by less than 4 percent, and the paper's own optimizer choices move them by a few percent, "far below the asymmetry and far below the size of the effects themselves."
It then splits the main part of the telescope's share of the mismatch, exactly, across kinds of measurement and scales on the sky; a few smaller terms are accounted for separately. With only DESI alongside, temperature measurements at fine scales lead in both directions. Once the Planck data are added, measurements of the light's polarization lead when D1 is tested at the 2018 fit, while the reverse direction is still led by temperature at fine scales. The paper also cautions that the setup with Planck differs in more than the Planck data: it uses a different physics code and lets different parameters vary. So the change in where the mismatch sits cannot be pinned on the Planck data alone.
Why the paper reports no new limit
The obvious next step would be to compute the limit with each release and report how much it moved. The paper tried, and explains why it will not.
Its first full runs drew random samples of the possible parameters with a single chain for each setting, a long random walk through the possibilities that should, given time, settle into a stable picture. "These chains are far from converged." For the 2018 release with DESI, the first half of the chain puts the 95th percentile, the usual upper limit, at 0.084 eV, and the second half puts it at 0.217 eV.
A larger campaign ran four to six independent chains per setting, judged by tests fixed in advance, and found a problem upstream of sampling: the fit itself depended on software details. Running the same points through two versions of the same physics code, CAMB 1.6.5 and 2.0.4, changed χ² by up to about 9, and by different amounts at different points. That matters because a uniform shift would leave the best parameters where they were, and an uneven one does not. "A version change therefore alters the shape of the likelihood, not just its normalization, and cannot be treated as a sampling correction." Twelve chains had passed every test declared in advance, and were then disqualified when it turned out that the code's reuse of stored intermediate results could slightly alter the fit. No other set of chains passed every test on a fixed numerical setup.
So the paper's abstract says: "We therefore report no tightening magnitude." The first version of the paper had reported how far the limit moved, by about 0.109 eV in one setup and about 0.012 eV in the other, both from single chains that had not converged. The second version withdraws those figures, and is careful about what that means: "They are withdrawn as unsupported. They have not been shown to be false. No replacement magnitude is given."
Two lessons about zero
A negative mass is impossible, so the analysis allows only values of zero or more. The outside analysis reported that with D1 the result is pushed against that boundary. A later section of the paper asks what such a boundary does to a result.
It answers in a simple model: two independent constraints on the mass, each a bell curve, and a flat prior, meaning that every allowed value is treated as equally plausible before the data come in. Its propositions about this model are checked in Lean, a proof assistant. The paper states plainly that it has not shown real data behave like the model.
The first lesson is about where the most likely value, the mode, can sit. If two constraints both prefer a positive mass, however much they disagree, the mode cannot be zero. "Tension between two constraints that both prefer positive masses can never move the mode to zero." Apart from the edge case where both constraints prefer exactly zero, a mode at zero needs at least one constraint pulling towards what would be negative mass. Even then, a mode at zero does not put any probability exactly on zero, and upper limits stay positive. Whether D1 supplies such a pull, the paper does not know: "Our own sampled posteriors cannot settle the question".
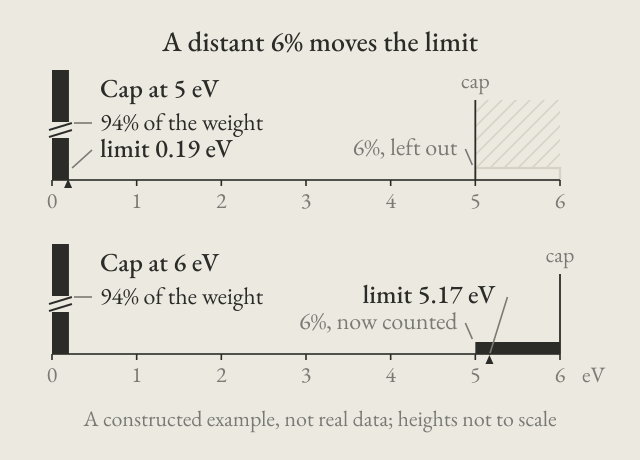
The second lesson is about the other end. Analyses also cap the mass at some large value, here 5 eV, which the paper calls the prior box. Across the 28 standard sets of chains the paper examined for this, the largest mass among the saved samples was about 0.36 eV, far from the cap, though some later trial runs with modified settings reached it before they had settled. The paper gives an exact example, built for the purpose, of why that alone does not make the cap harmless. Take a likelihood that equals 47/10 between 0 and 0.2 eV, 3/50 between 5 and 6 eV, and zero elsewhere. Capped at 5, the upper limit is 0.19 eV. Capped at 6, it is about 5.17 eV. "We do not suggest that the real likelihood behaves like this. The example only shows why the absence of samples near 5 eV is not, by itself, a proof that the prior box is irrelevant."
What it does not say
The paper identifies no cause. "We do not identify the instrumental or analysis cause of the disagreement, and we do not claim a correct value or bound for Σmν," where Σmν is the summed mass. Its fits come from numerical searches that are not certified to have found the best possible fit. It does not contradict the outside analysis, whose limits come from that team's own analysis code, with the lensing data that this paper leaves out. Nor does it say either release is wrong.
What it does say is that two releases of the same sky do not predict each other well. The parameters carried from one to the other include the neutrino mass itself, so which release is used is not a neutral choice. The decisive test is the one the outside analysis proposed, which the paper credits to it and does not perform: reprocess the 2018 raw data through the D1 pipeline. Until the disagreement between the releases is understood, in the paper's words, "a shift in a tight limit should be regarded as sensitive to packaging. This conclusion does not depend on the size of the shift, and it does not imply that either release is wrong."
Drawn from Six Birds for Neutrino Mass: Lens-Swap Stability and Packaging Audits (Tsiokos, 2026, version 2, doi:10.5281/zenodo.23161613). The audit values, chain results and quotations are from the paper; the 0.11 and 0.069 eV limits are Gorbunov and Nedelko's, as cited there. No new computation is claimed by this essay.