Posts · Method
Why Publish a 56 Percent Failure Rate?
A theory was pointed at a real engineering problem, with its predictions frozen before the scored runs. More than half of the first round failed. Then one of its fixes was predicted, in advance, to lose a test, and it did.
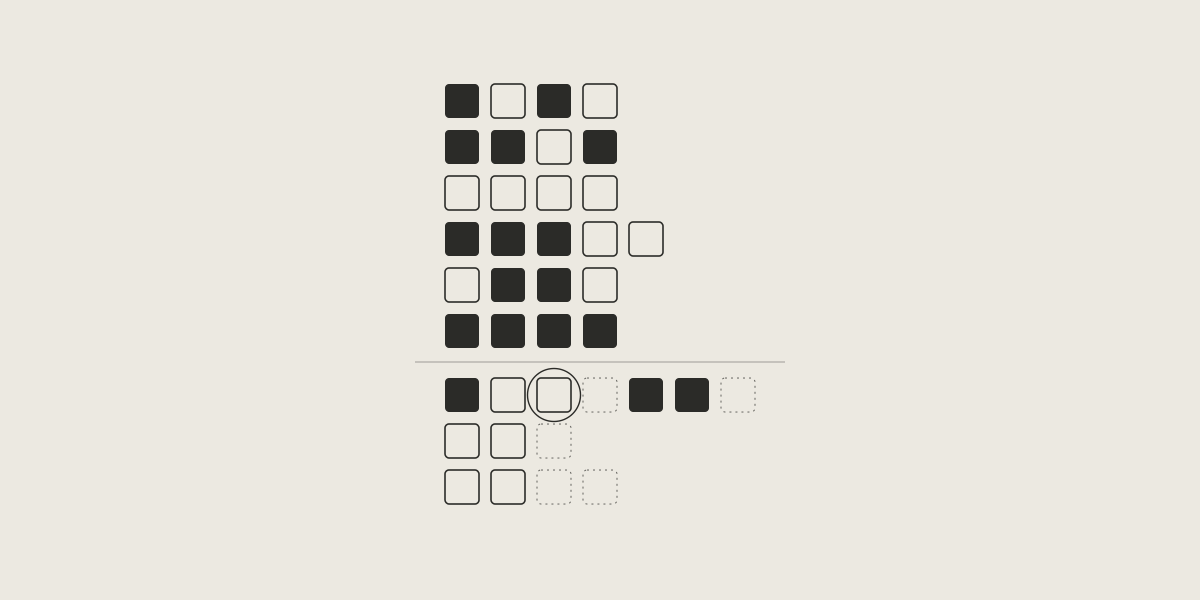
Here is a question you do not often see in a research paper: "Why publish a 56% failure rate?" The paper that asks it, Auditing Emergence in Quantum Error Correction, answers in the next sentence: "Because the failures are where the framework proved its worth, and leaving them in the file drawer would hide that."
The file drawer is the place where studies with disappointing results end up, unpublished, so that the published record looks better than the research did. The paper cites the classic statement of that problem by the psychologist Robert Rosenthal, from 1979. Its own response is to put every failure on the table, with its number.
The setup
Six Birds Theory is a framework for deciding when a simplified description of a system can be trusted to predict on its own, and for measuring what such a description misses. The paper turns its ideas into five concrete audit tools and points them at a real engineering problem: protecting quantum information from noise. An error-correcting code spreads information over several bits and keeps checking them for errors without reading the information itself; a decoder uses the check results to undo the errors. Bigger codes, with a larger "distance", tolerate more errors, and each simulated run is called a shot. The tools include a measure of what a decoder's view misses, a detector for changes in the noise, and a way to price extra checks.
Everything runs as a classical computer simulation of small codes. "No quantum hardware," the paper says, and none of the error-correction methods it uses is new. What is being tested is whether the theory's tools say anything useful in a domain where the answers can be checked.
The discipline is the interesting part. Before each experiment was built, every scored prediction was written down with a numeric pass or fail mark in a frozen design document. For the last two experiments, which needed working software before a trial run was possible, the marks were frozen from a pilot run on separate data before the scored run, a slightly weaker form of the same discipline. The rule for what happens next is blunt. "A failed prediction is a result in its own right. We report it with its bar, its measured value and a diagnostic reading, and we never re-run it with tuned parameters."
One caveat comes from the paper itself. The code was released publicly as a single snapshot, so the order of events rests on dated design documents and a log of deviations, not on a public version history. The checks are the author's own, run with published code and a test suite; the deviations log does record an outside review that caught one omission.
The ledger
The original build made 25 predictions across six experiments. Fourteen failed as frozen. That is the 56 percent in the title. A follow-up added nine more scored predictions, of which three failed. By my count from the paper's table, that makes 17 failures out of 34 overall; the paper reports the two parts separately.
Not everything failed. Four of the five tools came out with positive evidence. One of them, a certificate meant to vouch for a decoder, refused to approve a deliberately broken decoder even though its stability scores were perfect. The fifth tool, pricing, came out negative.
The paper sorts its failures into three kinds, and labels this sorting as its own interpretation.
A bar in the wrong units. One prediction concerned how far the best linear estimate of the protected information, built from the check results, misses. For small repetition codes at a noise rate of 1 in 20, it said this would fall below 0.01 and shrink tenfold as the code grew from distance 3 to distance 5. It came out at 0.0837 and 0.0740, a ratio of 1.13. The mark had been written as if the quantity were a probability that the decoder fails, which does shrink fast as codes grow. But the quantity was really the average squared error of that estimate, which follows different rules. "The failure is real and it taught us something concrete: predictions must be written in the object's own units, and the residual's units are variance, not failure probability."
A bar set too strictly. All four predictions about the theory's pricing tool failed. That tool puts a price on adding more checks: how much each extra measurement buys. In one, the frozen tolerance was a billionth, while the effects being tested lived between a hundred-thousandth and a ten-thousandth, four to five orders of magnitude larger. The tolerance could have been loosened afterwards. "We did not re-threshold after seeing the data, because a moved threshold is exactly what the discipline forbids." The verdict on the tool is just as flat: "We do not soften this."
A wrong guess about the system. A memory witness, in the paper's sense, is a pair of histories that look identical now but lead to different futures. The paper built a noise pattern that switched back and forth on a fixed schedule, intended as a fake source of such memory that the theory's tools should expose. It predicted that once the schedule was built into the model, the witnesses would vanish. They did not: all four survived. On reflection, the schedule really did carry information about what came next, so the tool was right to refuse to call the memory fake. "The control mechanism worked, and what it falsified was our registered hypothesis." The lesson: "'externally scheduled' does not imply 'predictively empty.'"
The detector that failed, and the loss that was predicted
The heart of the paper follows one failure all the way through. The experiment tested detectors for drift, a change in the noise that a decoder is not expecting. The detector that could actually be deployed, one that looks only at the error-correction measurements, never met its registered criterion, an alarm in at least 9 of 10 runs, at any sample size up to 16,000 shots. A reference detector that peeks at information unavailable in practice did detect the drift, but only twice as fast as the standard method, which simply watches how often the decoder fails, and short of the fourfold mark that had been registered.
Instead of tuning the detector until it passed, the paper diagnosed it with calculations from the theory's toolkit. It found that the statistic threw away the clearest part of the signal, that a second step diluted what was left, and that its alarm threshold had been borrowed from the reference detector instead of being set on its own. It also found a structural fact. The drift in the test had been placed on one particular pair of bits, and of the three placements the paper eventually compared, that one sat where a detector of this kind is weakest: almost on one of the shortest paths to the code failing, which is exactly what watching for failures notices. There, by the paper's comparison, each shot's check results carry only 0.665 times the information about the drift that the failure count does.
Then the paper registered a corrected detector, with new frozen predictions, as a new experiment. One prediction said the corrected detector would be at least ten times faster on a drift placed away from those weak spots. It was: the corrected detector caught that drift after 1,000 shots, while the standard method had not caught it by 16,000. Another prediction said it would still lose on the original test, and that is what happened: the standard method caught the drift after 1,000 shots, the corrected detector only after 4,000.
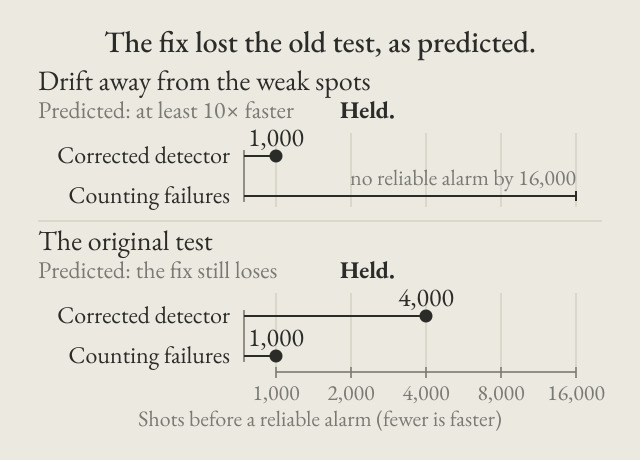
The paper says that the loss matters more than the win. A fix developed after a failure invites the suspicion that it was quietly tuned until the old test passed, which the philosopher Imre Lakatos called a degenerating move. A tuned fix would have won the old test. This one was predicted, from the diagnosis's own numbers, to lose it.
A frozen prediction, backed by exact computation, that the correction would still lose on the original test, followed by exactly that loss, is the strongest evidence this arc can offer that the diagnosis explained the failure rather than fitting it.
The follow-up has failures of its own, reported the same way. Its three are a false alarm rate of 6 percent against a 2 percent mark, a recalibrated threshold that came out 1.33 times the old one instead of a tenth of it, and a step meant to name which bits drifted that picked a bit from the drifted pair in only 3 of 10 runs against a mark of 8. Its passes come with caveats too. In a more realistic simulation the corrected detector cleared its registered twofold mark exactly, which the paper says should be read "not as a comfortable win". In a loop on one channel known to drift, where it decided when to recalibrate the decoder, it beat a blind schedule matched afterwards to the same number of recalibrations. Whether it beats a schedule with five times as many was a comparison with no registered mark, and at ten runs it is unresolved.
A pass that the paper undercuts
Not every success survives the paper's own scrutiny. One registered prediction asked for a correlation of at least 0.9 between two measures across a table of noise models. It came out at 0.936 and passed. The paper then points out that this rests on one model: "Without N5 the correlation is r = −0.171, so the registered correlation is carried by N5 and does not hold on the remaining models." A pass is reported as a pass, with the reason not to lean on it right beside it.
What it does not say
All of this is classical simulation of small codes, judged against its own frozen marks. It is not hardware evidence, it makes no claim that the corrected detector beats failure counting in general, and the pricing tool, on this evidence, "stands negative". The paper is equally plain about what a single study can do for the theory as a whole: "Nothing here validates SBT's broader ambitions in other domains. One domain, carefully instrumented, is one data point."
What it does show is a way of working. Every scored prediction is frozen before its scored run, every failure is printed with its number, and the deviations from the plan are logged in an appendix, which the paper calls "evidence for the process, not an embarrassment to minimize". A 56 percent failure rate, reported this way, gives a reader more reason to trust the passes than a perfect record would.
Drawn from Auditing Emergence in Quantum Error Correction: A Falsifiable Instantiation of Six Birds Theory (Tsiokos, 2026, version 2, doi:10.5281/zenodo.23120470). The predictions, numbers and quotations are from the paper; the overall count of 17 failures in 34 is mine, from its ledger. Rosenthal (1979) and Lakatos (1978) are as cited there. No new computation is claimed by this essay.